Power BI is a business analytics software or data analytics tool used by organizations to discover insights within their business data. It enables organizations to collect, combine, analyze, visualize, and publish data as reports.
Organizations would have their criteria for publishing and sharing their reports, sometimes opting as private or public.
Microsoft Power BI facilitates cloud-based reports sharing through the Software as a Service (SaaS) platform using the Power BI service. Moreover, on-premises reporting is possible through the Power BI Report Server.
Power BI Service, a cloud-based platform allows reports to be shared with users for easy collaboration. If your organization does not want the reports to be exposed in the cloud, an on-premises platform is needed for publishing and sharing reports within the organization.
Power BI Report Server, on the other hand, serves as the on-premises portal for reporting. Since it is hosted on-premises, it enables you to host and share reports within your environment. It offers enough capabilities that allow organizations to host reports within their environment and share with users.
Publish and distributes Power BI reports on-premises
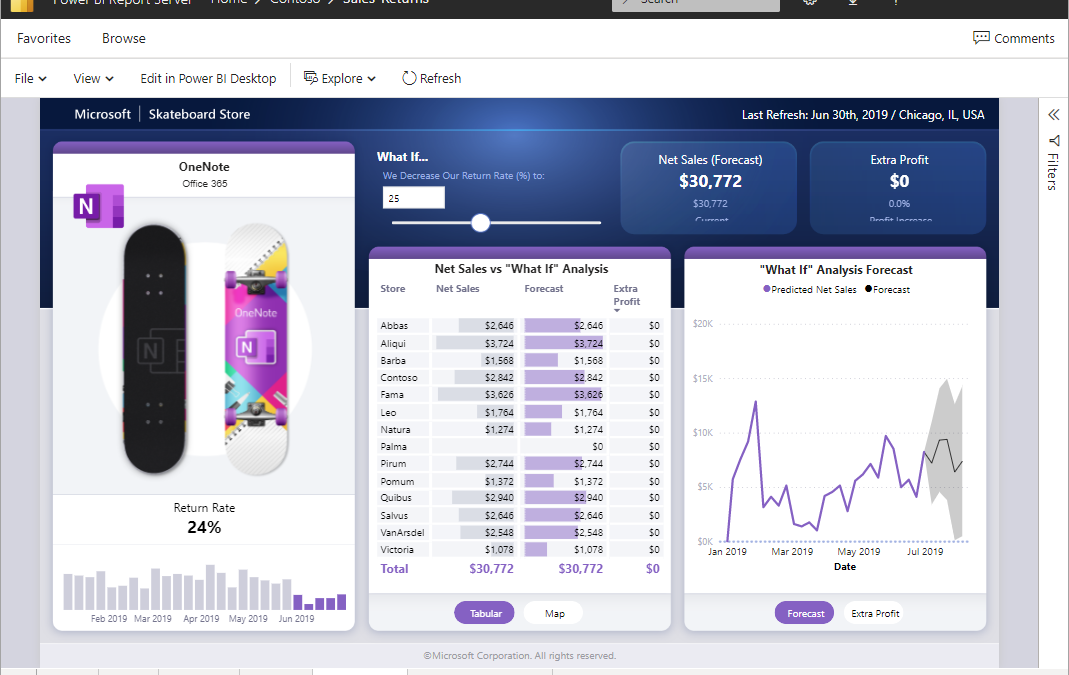
Power BI Report Server is an on-premises platform used to host and share Power BI reports. Report Server gives users access to interactive reports. By exposing your data visually through reports, users can identify trends to make informed decisions. Users can generate well formatted reports about your business needs performance and share them with others easily.
- Create reports with Power BI Desktop and explore data through various visualization methods
- Publish reports to Power Report Server and unify your reports in folders, manage user access and update when needed.
- Share reports for users to use on the web and across mobile devices to address various business needs.
To unlock complete value of your business data, utilize data analytics tool, Microsoft Power BI with the help of Microsoft Gold Partners or Microsoft Power BI implementation Partners. LITS SERVICES help you improve analytics capabilities through right Power BI consulting and implementation services.
Power BI Report Server feature summary, first release January 2024
Microsoft constantly updates the platform with new features to help businesses meet their needs. Here are some features recently released for Power BI Report Server.
- Show data visuals as tables
- Styling features for columns and bar charts
- Extended data labels
Show visuals as tables
Power BI Report Server is added with a new view mode called “Show visuals as table”. This feature presents your report displays in a tabular format with a single selection.
“Show visuals as tables” will present data displayed in a text-based format or report as tables. In addition, the view mode feature allows users to interact with and cross-filter the data, providing a more structured representation of the data. This is beneficial for in-depth analysis and exploration.
Styling options for columns and bar charts
The latest version has introduced additional formatting improvements for bar charts and column charts in Power BI. More style options make data visualization more attractive, enabling deeper analysis of data and enhanced storytelling capabilities.
Key Improvements
- Apply formatting options across all categories with Apply Setting to All or Series
- Achieve the perfect balance of visibility and design with transparency control
- Create borders perfectly with Border Customization
- Create visual continuity with Advanced ribbon settings
These features allow you to present your data in a compelling visual way, ensuring you gain insights from data with clarity.
Customization for data labels
Data labels have advanced customization capabilities with this new release that power your reporting needs with a seamless experience. The new capabilities improve data analysis experience which helps you gain insights quickly.
- The New Title card feature allows you to display legend fields on your data labels.
- Customize data label titles with distinct colour and transparency.
- The New Detail card feature allows the inclusion of secondary metric.
- Choose between a sleek single-line data label or multi-line data label.
New features available for column, line, bar, and ribbon charts can transform your reporting experience.
With new features in Microsoft Power BI software, you can take your data analysis experience to new levels. When you connect with leading Power BI implementation partners, LITS Services, your reporting capabilities can be improved, helping you make meaningful and confident decisions that help grow your business bottom line.
Our business intelligence consultants provide detailed Power BI consulting to help you in assessing Power BI license costs and realizing the analytics services you envisioned.
As a Power BI implementation partner in the UAE, we have experience in implementing Power BI desktop and customizing Power BI dashboards to meet reporting requirements.
Apart from the UAE, LITS services cater to the needs of organizations in various countries including Saudi Arabia, Oman, Qatar, Bahrain, Jordan, Kenya, Germany, Canada, Pakistan, and India.